Innovating Data Collection - Serving Businesses Worldwide

Published On:
April 29, 2026
Cliqforms helps you analyze your form performance and improve results with key metrics. Here is an overview of the key metrics of the CliqForms form.
1. Views: The total number of views across all your existing forms.
2. Submissions: The total number of leads captured by all your existing forms.
3. Partial Submissions: The user doesn’t complete the submission and opts out halfway.
4. Conversion Rate: The average conversion rate across all your existing forms (Leads/Unique Form Visitors). Visitors are different from views, as one person can view a form multiple times.
5. Completion Time: The average time it takes users to submit the forms.
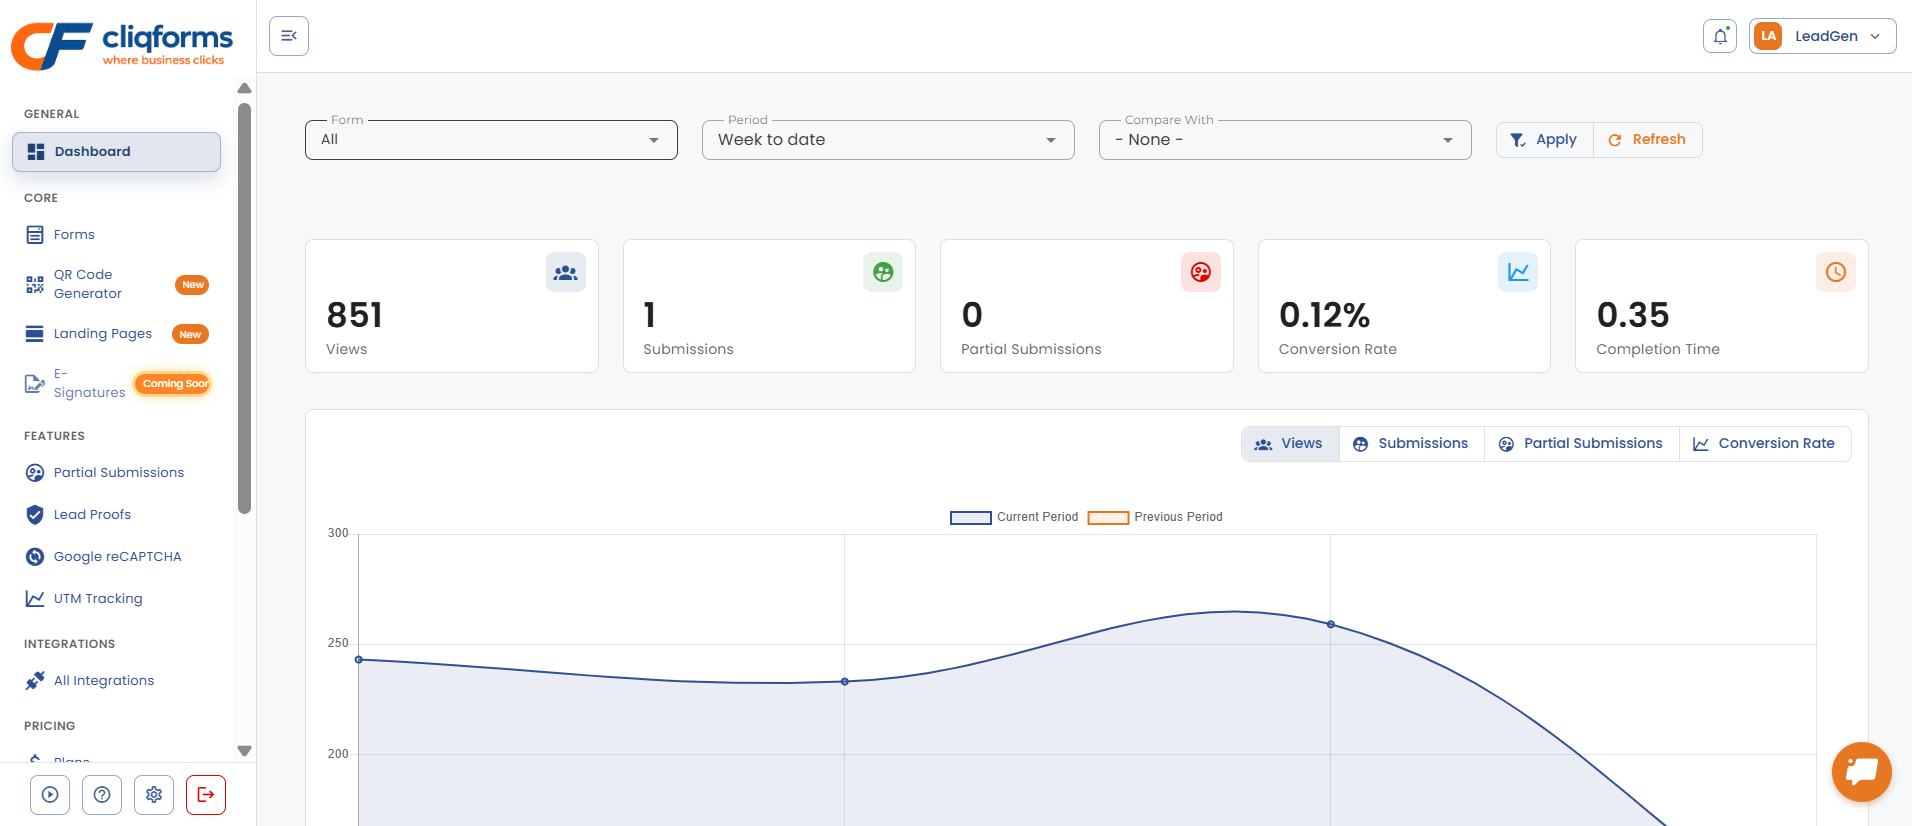
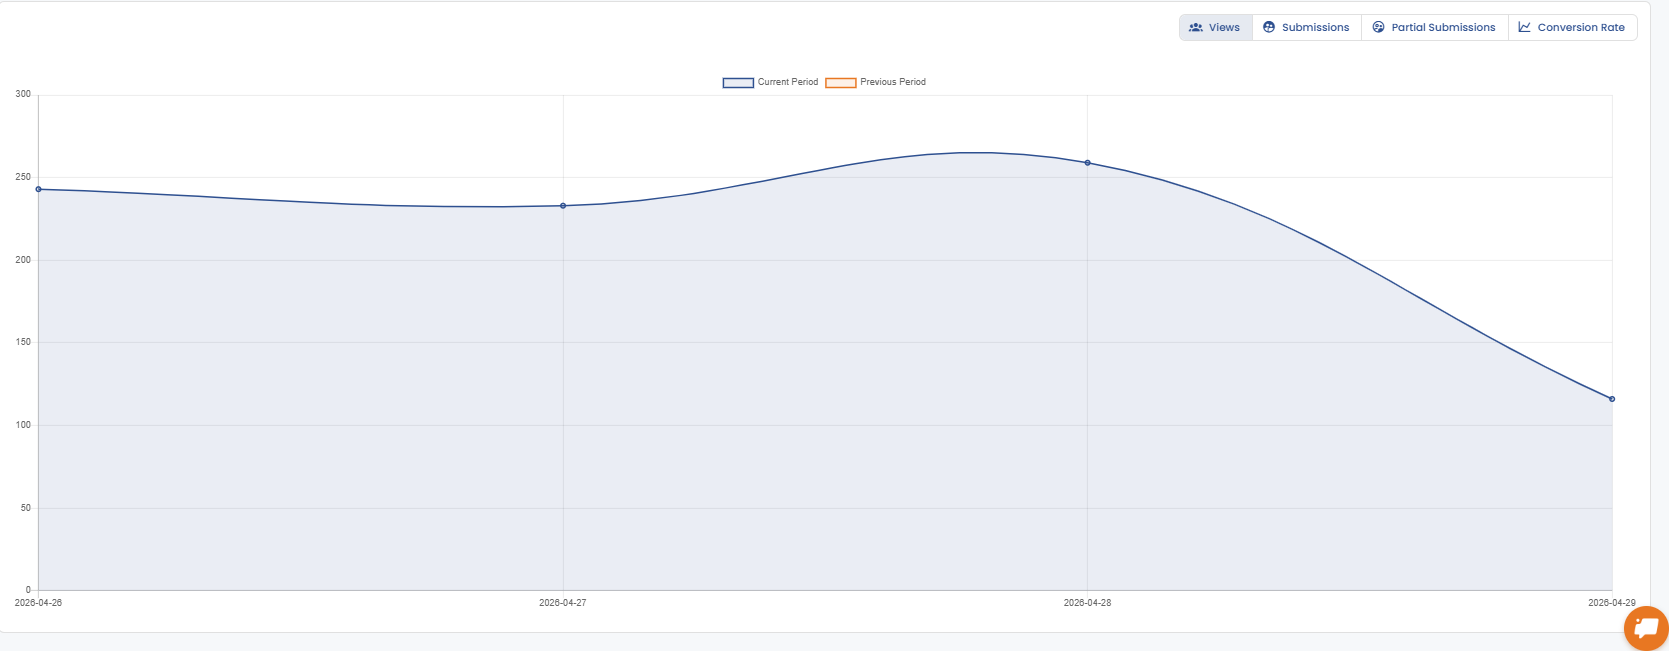
Below the four boxes, you can see a graphical representation of form views by default. You can always edit it to display leads or the overall conversion rate using the top-right corner dropdown menu.
There are three dropdown options at the top of the page – “Form”, “Period”, and “Compare With” to analyze your form performance. When you make a change and select something from one of the dropdown menus, all the numbers on the page will change to reflect the data exclusively for your selection.
In the first one, called "Form," you can find all your forms listed, and you can use the checkbox to select one or multiple options to see the stats for one or more of your forms only.
After making your selection, a button called “Apply” will show up. Click on it to update the page.
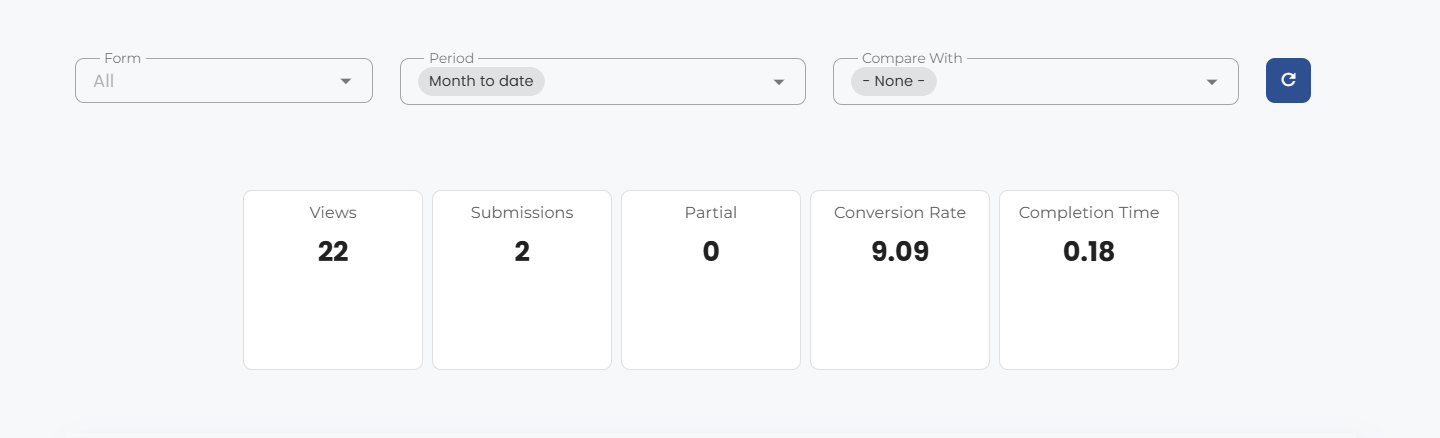
The second option is the “Period” dropdown, which has eleven date presets to choose from, or a custom one to choose whatever time range you want to look at.

The last one is called “Compare With” and is useful for comparing results from different periods. The presets are “Previous Period” (if you select “Last Week” from "Period," it means it will compare last week to the previous week), “Previous year”, or "Custom.".

Using it will add new numbers on the screen, showing the positive or negative evolution in the first three boxes. The line chart will also have two different data sets for the two periods.

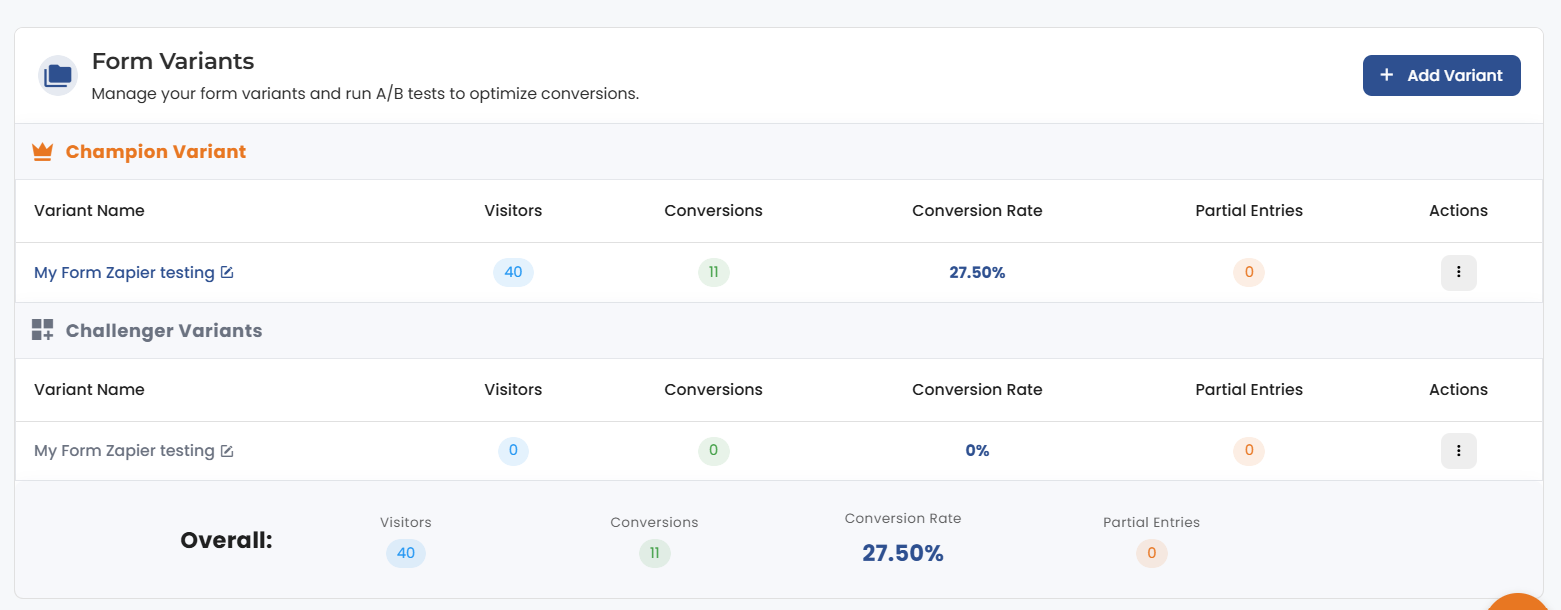
Next, take a look at the statistics for each form. You can do so by going to “Forms” and then selecting one from the list. You will land on the overview page of your form, where you have the "Visitors," "Conversions," and “Conversion Rate” numbers at the top.
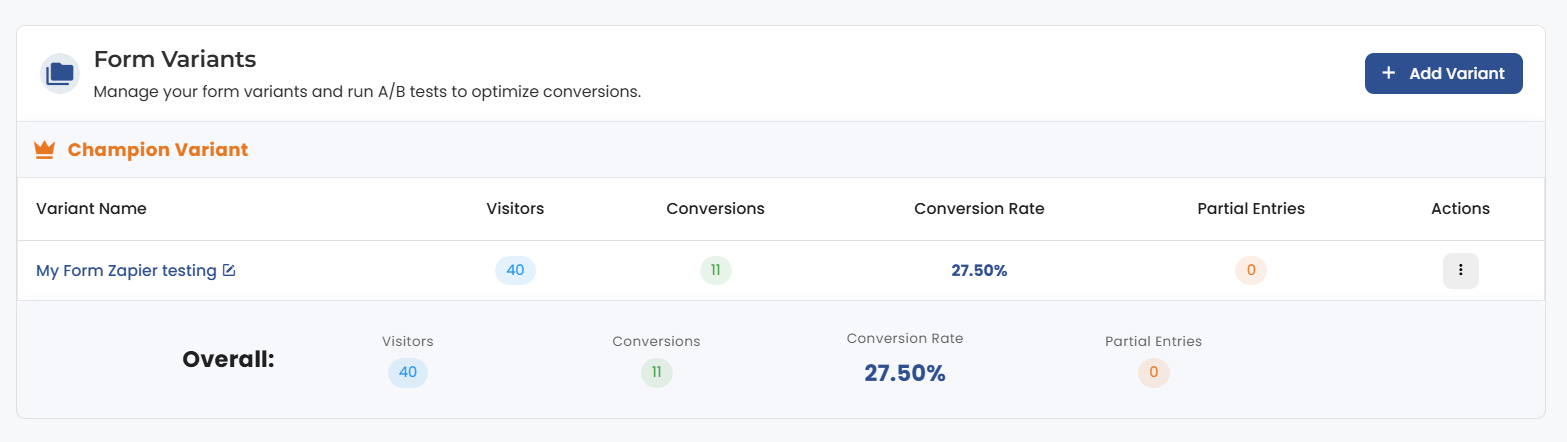
If you have multiple variants running, scrolling down will show you the numbers for each version. Thus, helping you find the winning one.

.png)
